When you purchase through links on our site, we may earn a commission. Here’s how it works.

Does it seem like all your friends and neighbors have armed themselves with home and personal security devices? Is this because crime rates are rising or because high-tech security devices are the latest trend? Let’s take a look at the latest crime and burglary statistics.
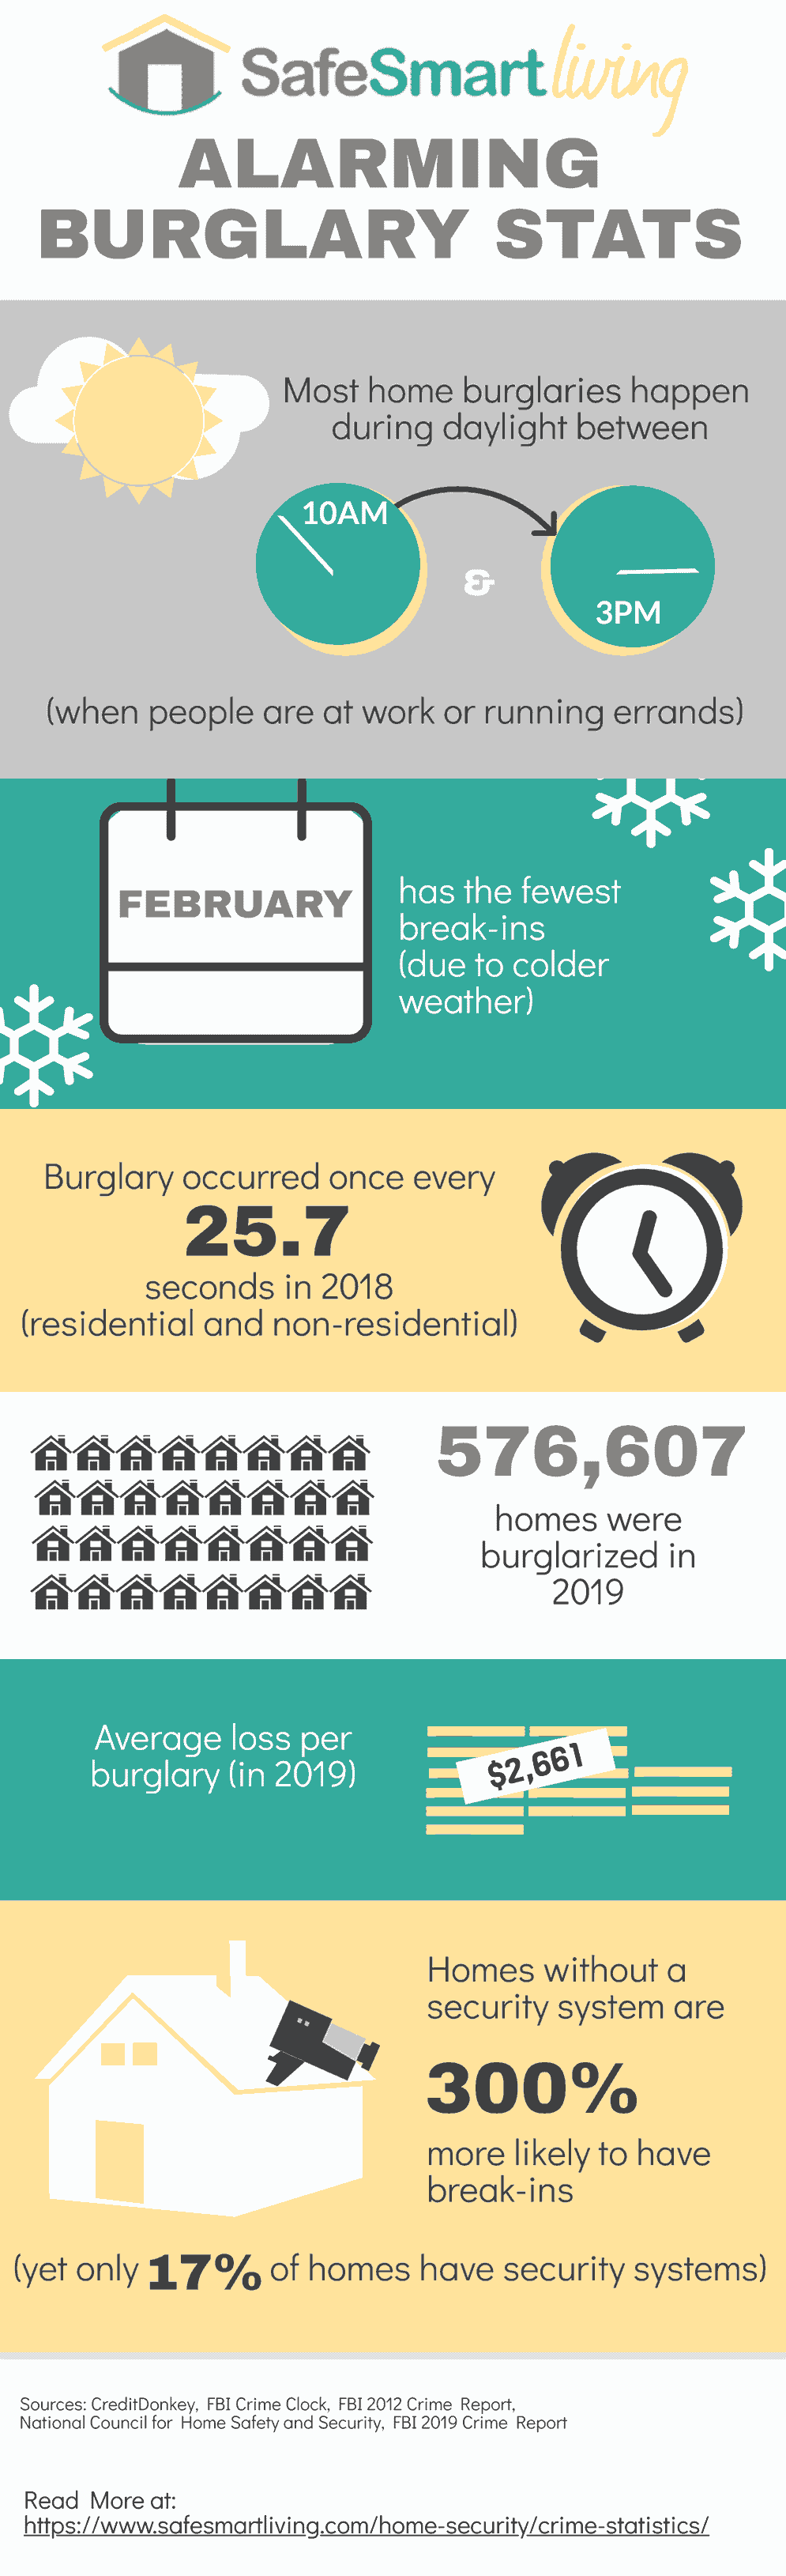
When Do Most Home Burglaries Occur?
Most people are afraid of break-ins at night while they’re sleeping. In fact, according to SimpliSafe, most home burglaries occur between the hours of 10am and 3pm during daylight hours while people are at work or running errands. Burglary rates are highest in summer and lowest in winter, according to the National Council for Home Safety and Security
What Are The Chances Of My House Being Robbed?
Just how often do robberies occur? Every 15 seconds in the U.S. a home burglary takes place in the United States (up to 4,800 a day) according to Crimepreventiontips.com and Jacksonville State University.
Here are two of the most recent residential burglary and home security statistics from the FBI’s 2021 Crime Data Explorer:
- There were an estimated 34,145,374 property crime incidents in 2021. Of those 1,680,287 took place in a residence (38%).
- There were 586,564 burglary incidents in 2021 and 61% of those took place in a home (compared to only 6% commercial).
Of course, these are national statistics, and your chances of a home burglary depend on where you live and other factors.
What Cities Have The Highest Crime Rates?
The following crime statistics by city are based on data from the FBI’s 2019 Crime Report. We’ve listed the top 10 metropolitan areas with populations greater than 250,000, starting with the highest crime rates per 100,000 people. (We bolded the cities listed in two or more lists.)
Keep in mind, these lists only include the cities that report crime statistics to the FBI any given year — many don’t, including major metro areas like Chicago, Dallas, and New York to name a few (D.C, Los Angeles, Boston, and Miami metro areas did report stats in 2019).
NOTE: The FBI website cautions against using its annual data for city rankings. “These rankings lead to simplistic and/or incomplete analyses that often create misleading perceptions adversely affecting cities and counties, along with their residents.”
Top 10 Cities With The Highest Burglary Rates
These burglary rates include residential and non-residential dwellings.
- Bakersfield, CA – 847.3
- Vallejo, CA – 833.7
- Lubbock, TX – 813.9
- Memphis, TN – 769.0
- Tulsa, OK – 737.0
- Oklahoma City, OK – 678.7
- Lafayette, LA – 619.4
- Springfield, MO – 614.2
- Spartanburg, SC – 610.5
- Shreveport-Bossier City, LA – 608.3
Top 10 Cities With The Highest Violent Crime Rates
The FBI’s reporting system defines violent crimes as those offenses that involve force or a threat of force. These include murder and nonnegligent manslaughter, rape, robbery, and aggravated assault.
- Anchorage, AK – 1,194.6
- Memphis, TN – 1,120.5
- Albuquerque, NM – 1,043.4
- Detroit-Dearborn-Livonia, MI – 984.3
- Lubbock, TX – 838.5
- Stockton, CA – 788.5
- Little Rock, AR – 782.3
- Wichita, KS – 781.2
- Corpus Christi, TX – 736.9
- Gainesville, FL – 692.1
Top 10 Cities With The Highest Murder Rates
These include both murder and non-negligent manslaughter.
- Detroit-Dearborn-Livonia, MI – 18.0
- Memphis, TN – 17.6
- New Orleans-Metairie, LA – 15.9
- Baltimore-Columbia-Towson, MD – 15.5
- Baton Rouge, LA – 14.1
- Anchorage, AK – 11.1
- Shreveport – Bossier City, LA – 10.4
- Albeququerque, NM – 10.1 (tied for 8th place)
- Little Rock, AR – 10.1 (tied for 8th place)
- Greensboro-High Point, NC – 9.7
Home Break-In Statistics Infographic
National Crime Statistics
The following statistics also come from the FBI’s 2021 Uniform Crime Reporting (UCR) released in October 2022. The report which has been collecting and reporting stats since 1930, had lower-than-average participation from local law enforcement agencies submitting data (which is voluntary). New York City and Los Angeles did not participate which can skew the numbers off a bit and it’s not conclusive of the bigger picture. The lack of participation was due partially to a new system of collecting.
What’s The National Violent Crime Rate?
- In 2021 the estimated number of violent crime incidents in the U.S. was 694,050 with 817,020 offenses reported, according to the FBI’s Crime Data Explorer.
- The violent crime rate is 398.5 per 100,000 in 2021.
What Are The National Murder Statistics?
The total number of reported homicides in 2021 was 13,537. A majority of victims are in their homes and the relationship is unknown to the offender. A handgun is the most common weapon.
Top 6 Hate Crime Statistics
Hate crime data from the National Incident-Based Reporting System (NIBRS) and the Summary Reporting System) collects information voluntarily submitted to the FBI. In 2020 there were 8,263 total reported hate crimes.
- 63% race/ethnicity/ancestry
- 15% religion
- 13% sexual orientation
- 3% gender identity
- 2% disability
- 1% gender
Illegal Immigrant Crime Rates
There are no formal reports of crimes committed by undocumented immigrants, but a recent analysis by The Marshall Project sheds the best light to date of how illegal immigration may have affected crime rates in the U.S. since 2007 according to The New York Times.
The analysis compares estimates of undocumented populations by metro area compiled by the Pew Research Center with local crime rates published by the FBI. Three key takeaways from their findings, which analyzed undocumented immigrant populations and crime rates between 2007 and 2016, include:
- Violent crime decreased slightly across most areas, regardless of whether the undocumented population rose or fell.
- Property crime was either entirely unaffected or fell slightly, even with a population rise in undocumented immigrants.
- When breaking out violent and property crimes into each component (aggravated assault, murder, robbery, burglary and larceny), there is again no connection between crime rates and undocumented populations.
How Can You Protect Your Home And Yourself?
Home Security
A study by Rutgers University found that having a residential burglar alarm system decreases crime. And even more notable, neighborhoods with multiple burglar alarms have fewer residential burglaries than those with fewer alarms.
See our reviews of the best home security systems to find one that fits your needs and budget. We also put together a list of simple ways to deter a burglar that you might wish to employ.
Personal Security
How can you protect yourself when you’re out alone, especially at night when assailants are on the prowl?
There are some measures you can take to arm yourself against violent crimes and other personal assaults. Check out our article about the best taser flashlights and stun guns to find out how to protect yourself on-the-go.